
What goes into an HPC project?
This article is my attempt to answer a question that kept appearing during projects and competitions: what do I need to know to work effectively in HPC?
The short answer is A LOT. There is always another layer to understand, another tool to discover, or another optimisation to test. This is therefore not an exhaustive curriculum. It is an orientation map based on what I understand as of 1 August 2026, shaped by a lot of searching, help from seniors and teammates, and the frustration encounter with unfamiliar parts of the stack.
I have organised the map into three parts:
- Knowledge stack: the subjects that help you reason about a system.
- Software and Hardware stack: the tools and layers you are likely to encounter.
- Abstracted HPC workflow: a repeatable process to fall back on when a project becomes messy.
My goal is the useful is to introduce the 20% (So you can fathom the 80%): enough of a mental model to recognise where you are, ask better questions, and approach more difficult material without feeling completely lost. Some detail is deliberately compressed because a map only works when you can still see the whole territory.(ie. Some details are omitted)
Treat this as a set of coordinates, not a checklist. You do not have to become an expert in every box before you are allowed to build something.
Knowledge Stack
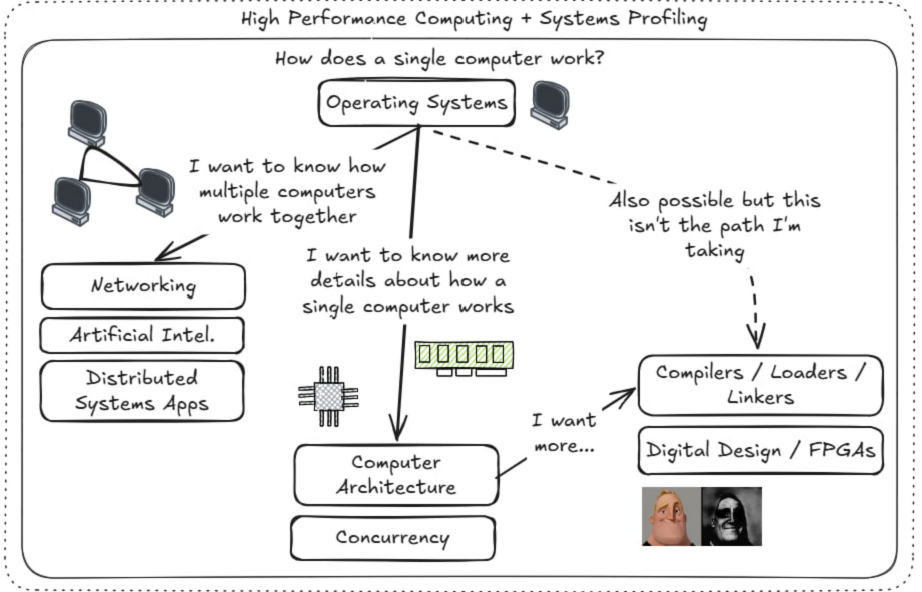
There is a lot to know, but you do not have to be excellent at every topic. It helps far more to build a broad systems foundation and then develop depth in one or two areas that match your interests.
I would start with operating systems. Almost every path eventually returns there. System calls form an important boundary between user-space programs and the services provided by the kernel. Processes, threads, virtual memory, files, devices, scheduling, permissions, and networking all become easier to connect once you understand what the operating system is doing between an application and the machine.
From that centre, I see three broad directions.
Upward: make multiple parts work together
If you are interested in how nodes, services, or workloads communicate, continue into:
- Networking, to understand how data moves and where communication costs come from.
- Distributed systems, to reason about coordination, failures, consistency, and work spread across machines.
- Artificial intelligence and distributed applications, where those systems ideas become concrete workloads with demanding compute and communication patterns.
Downward: understand one node in more detail
If you want to know why a single machine behaves the way it does, continue into:
- Computer architecture, including processors, caches, memory hierarchies, accelerators, and interconnects.
- Concurrency, including threads, synchronisation, parallel execution, contention, and the gap between work that could run in parallel and work that actually does.
Deeper still: toolchains and hardware logic
If you want to move closer to the machine, explore compilers, loaders, linkers, digital design, and FPGAs. These are not the only possible routes, and it was not my initial path, but it explains how programs become executable work and how hardware can be designed for particular workloads.
None of these branches are wrong answers. The difficult part is accepting that reaching a useful general level across the map takes time, plus genuine depth in one or two areas is usually the standard. HPC and systems profiling wrap around the entire map: profiling is most useful when you have enough intuition to explain the behaviour you measure.
Software/Hardware Stack
This map began with a familiar debugging experience: an application failed with an NCCL-related error, and I realised I had met yet another part of the stack without knowing where it belonged. Looking up one term often introduces three more, until it feels as if you are searching for everything and understanding nothing.
The layered view below is meant to fix that orientation problem. It is not a canonical or exhaustive taxonomy; tools can cross layers, and different clusters make different choices. Its purpose is to help you identify which part of the system you are currently dealing with.
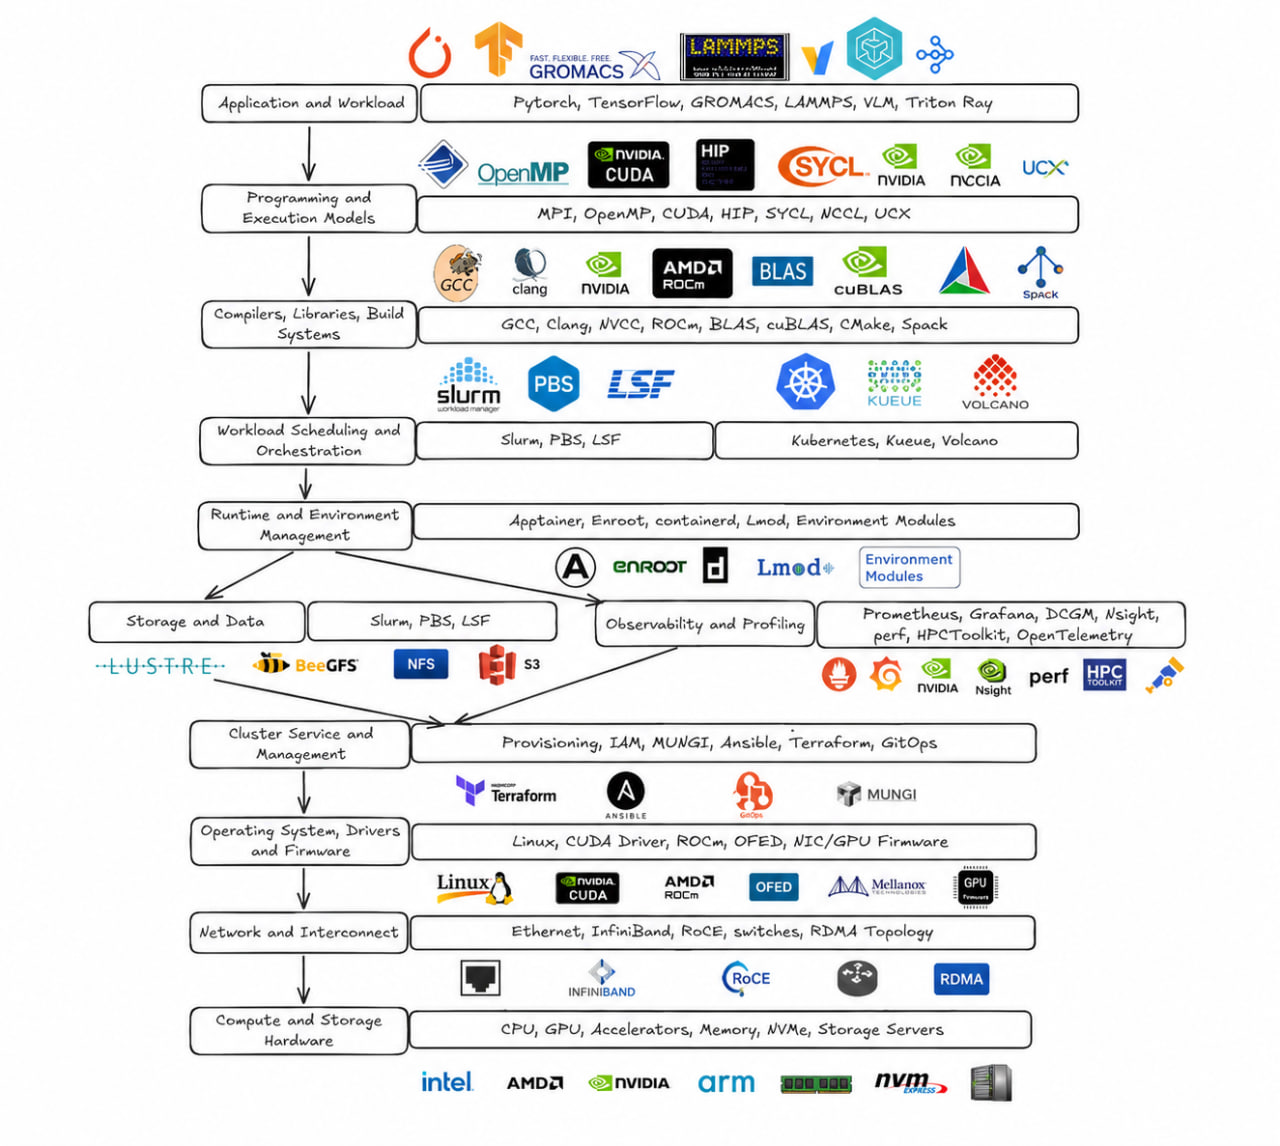
From the machine upward
- Compute and storage hardware: CPUs, GPUs and other accelerators, memory, NVMe devices, and storage servers supply the physical resources.
- Network and interconnect: Ethernet, InfiniBand, RoCE, switches, and RDMA topology determine how data moves within and between nodes.
- Operating system, drivers, and firmware: Linux, GPU drivers and runtimes, OFED, and device firmware expose the hardware to the software above it.
- Cluster services and management: provisioning, identity and access, configuration management, and infrastructure tools keep a group of machines usable and consistent.
- Runtime and environment management: containers and environment modules make dependencies available in a controlled, repeatable way.
- Workload scheduling and orchestration: systems such as Slurm, PBS, and LSF decide when and where jobs run. Kubernetes-based tools may appear in environments that mix HPC and cloud-native workloads.
- Compilers, libraries, and build systems: GCC, Clang, GPU toolchains, numerical libraries, CMake, and package managers turn source code and dependencies into runnable software.
- Programming and execution models: MPI, OpenMP, CUDA, HIP, SYCL, NCCL, and UCX express parallel work or provide communication paths.
- Applications and workloads: frameworks, simulations, inference engines, and domain applications are the layer most users directly run.
Storage, observability, and profiling do not fit neatly into a single rung. A workload may read from a parallel filesystem, emit metrics and logs, and be inspected with profilers across the entire run. Those cross-cutting paths are often where performance problems become visible.
Abstracted HPC Workflow
A list of technologies is not useful without a way to apply them. The workflow below is the structure I would fall back on during an HPC project or competition.
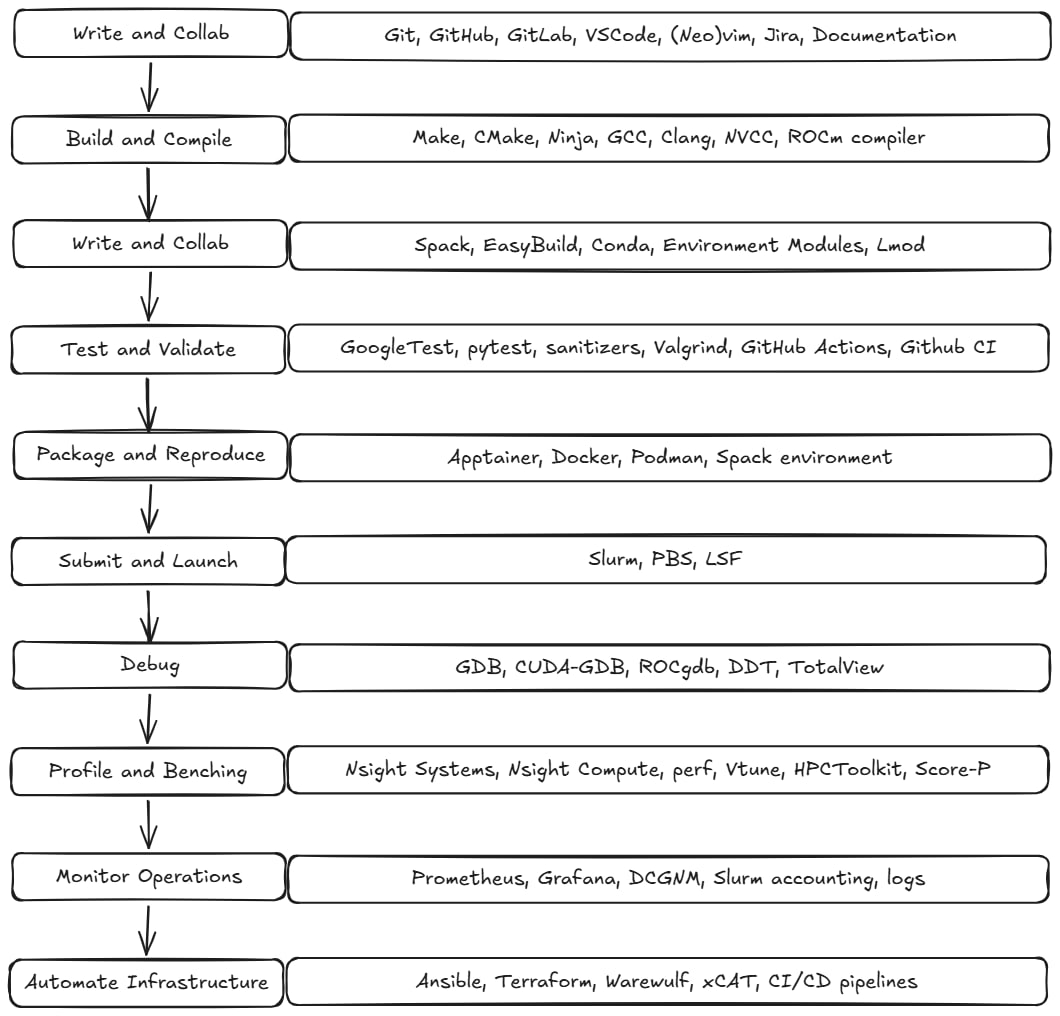
- Write and collaborate. Keep source code, experiments, decisions, and documentation together. Version control is part of the experiment record, not just a backup.
- Build and compile. Make the toolchain explicit. Record the compiler, flags, architecture targets, and library versions that produced the binary.
- Manage dependencies and environments. Use package managers, modules, or environment tools so another machine—or your future self—can reconstruct the setup.
- Test and validate. Before chasing speed, confirm correctness. Unit tests, sanitizers, CI, and small validation cases protect you from optimising the wrong result.
- Package and reproduce. Containers or captured environments make the run portable enough to repeat on another node or cluster.
- Submit and launch. Express resource requirements clearly to the scheduler: nodes, accelerators, memory, time, placement, and any job dependencies.
- Debug. Reduce failures to a small case and decide whether the problem is in the application, environment, runtime, communication layer, scheduler, driver, or hardware.
- Profile and benchmark. Start from a baseline, choose a metric, change one variable, and measure again. Use the profiler that matches the suspected layer rather than collecting every metric at once.
- Monitor operations. Metrics, scheduler accounting, device telemetry, and logs reveal behaviour that a one-off benchmark can miss.
- Automate infrastructure. Once the process is understood, automate repeated configuration and deployment work so experiments remain consistent.
In practice, this is a loop. Profiling may send you back to the compiler; validation may expose an environment mismatch; a scheduler result may reveal poor resource assumptions. The value of the workflow is that it gives you a known place to return to.
How I would begin
If the map feels too large, choose one workload and follow it through the stack:
- Run it once and record a correct baseline.
- Identify whether the limiting resource appears to be compute, memory, communication, storage, or orchestration.
- Learn the layer immediately below the symptom.
- Make one change and measure the result.
- Write down what you expected, what happened, and what you now believe about the system.
That process turns isolated facts into a functional mental model. Over time, names such as NCCL, Slurm, RDMA, NVCC, or Nsight stop being random acronyms and become coordinates: communication library, scheduler, transport mechanism, compiler, profiler.
I hope this map saves someone a little of the frustration that produced it. Much of it came from searching, asking AI, learning from seniors and teammates, and failing until the missing layer became visible. If it helped, click the duck at the bottom of the page; that feedback tells me which direction would be most useful to explore next.